For a pdf version of the following, click here.
Gainesville Alachua County Regional Airport Authority
Title VI Plan
1. Title VI Policy Statement[1]
The Gainesville Alachua County Regional Airport Authority (“GACRAA” or “the Authority”) operates Gainesville Regional Airport (“GNV”) and assures that no person shall on the grounds of race, color, national origin (including limited English proficiency (LEP)), sex (including sexual orientation and gender identity), creed, or age, as provided by Title VI of the Civil Rights Act of 1964, the Civil Rights Restoration Act of 1987 (PL 100.259), Section 520 of the Airport and Airway Improvement Act of 1982, and related authorities (hereafter, “Title VI and related requirements”), be excluded from participation in, be denied the benefits of, or be otherwise subjected to discrimination under any program or activity that receives U.S. Department of Transportation (DOT) funding. Title VI also prohibits retaliation for asserting or otherwise participating in claims of discrimination.
The Authority further assures every effort will be made to ensure nondiscrimination in all of its programs and activities, whether those programs are federally funded or not. The Authority agrees, among other things, to understand the communities surrounding or in the flight path, as well as customers that use the airport. Anytime communities may be impacted by programs or activities the Authority will take action to involve them and the general public in the decision-making process.
The Authority requires nondiscrimination assurances, as prescribed by FAA, from each tenant, contractor, and concessionaire providing an activity, service, or facility at the airport. Assurances must be included in any related lease, contract, or franchise agreement between the Authority and each tenant, contractor, and concessionaire, as well as in any similar agreements with their own sub-tenants and sub-contractors.
Lynn Noffsinger, Grants and Contracts Administrator, available at (352) 373-0249 ext. 123 and lynn.noffsinger@flygainesville.com, is responsible for overseeing the Airport Sponsor’s compliance with Title VI and the point of contact for all airport Title VI matters and related responsibilities, including those required by 49 CFR Part 21.
Allan Penksa August 1, 2024
Signature Effective Date
Allan Penksa
CEO
August 1, 2027
3-Year Expiration Date
2. Administration
GACRAA has reviewed and adopted this Title VI Plan for GNV. This plan will be updated no less than once every 3 years. The plan will not be re-adopted following minor changes, such as updating the Chief Executive Officer’s or Coordinator’s name. Significant revisions to our policies or federal guidelines may warrant re-adoption by the Authority and resubmittal to FAA.
In addition to the Coordinator and airport sponsor’s leadership, the following people also assist with our Title VI program requirements:
| Staff Supporting Title VI Program | Airport Sponsor Program / Office |
| Suzanne Schiemann | Manager, Communications & Human Resources |
GNV has no airport program sub-recipients:
| Sub-Recipients |
| None |
As of the date of this plan, GNV has the following pending applications for Federal financial assistance:
| Federal Source | Grant Number | Amount |
| FAA AIP | GA Terminal Design |
$1,267,000 |
| FAA AIP | Commercial Apron Expansion Design | $ 495,000 |
| FAA AIP | Design Baggage Handling System Phase 2 | $ 335,000 |
| FAA AIP | Construct Baggage Handling System | $3,690,000 |
| FAA AIP | Airport Master Plan and Storm Water Master Plan | $1,208,000 |
Updated information for pending and awarded grant applications will be available through the following methods:
| Federal Source | Grant Award Information Available at: |
| FAA AIP | https://www.faa.gov/airports/aip/ |
3. Grant and Procurement Assurances
49 CFR § 21.7 (a)(1); 49 CFR Part 21 Appendix C (b)
GNV will complete standard grant assurances for Title VI and related requirements, in the form prescribed by FAA. See https://www.faa.gov/airports/aip/grant_assurances/#current-assurances.
Clauses/Covenants
- All contracts, leases, deeds, licenses, permits, and other similar instruments, must contain the contractual requirements and clauses, in the form prescribed by FAA. See https://www.faa.gov/airports/aip/procurement/federal_contract_provisions/. Note that unlike many other clauses, Civil Rights clauses are required in all contracts. Note also special clauses that are required for certain types of contracts, such as land acquisition.
- GNV requires Civil Rights clauses to be included in solicitations and contracts for all subcontractors, subleases, and any other agreements. This is accomplished through contract clauses in Prime contracts, requirements for flow down language in subcontracts, review of each prime Contractor’s standard subcontractor agreements, and periodic review of executed subcontracts.
| Description of Oversight Methods for Subcontracts |
| Subcontract required language is reviewed for each Prime Contractor’s standard contract and subcontracts are audited by the Grants and Contracts Dept. to verify they include the template language, for not less than 10 percent of contractors each year. |
4. Title VI Coordinator Responsibilities
The Coordinator is responsible for ensuring that they and other staff supporting the Title VI Program are trained in Title VI requirements. Essential training topics include:
- Basic Title VI requirements
- Airport language assistance resources and practices
- demographic data
- Reporting Title VI complaints and other required FAA notifications.
See Training Section for more information for expected training for all staff.
Among other responsibilities, the Coordinator:
- Proactively ensures that the Airport Sponsor is in compliance with nondiscrimination requirements of Title VI and reports to GNV leadership on the status of Title VI compliances.
- Responds promptly to requests by FAA for data and records and for the scheduling of compliance reviews and other FAA meetings to determine compliance with Title VI and related requirements.
- Receives discrimination complaints covered by Title VI and related requirements, and forwards them to the FAA, within 15 days of receipt, together with any actions taken to resolve the matter.
- Provides the FAA with updates regarding its response and status of early resolution efforts to complaints concerning Title VI and related requirements (49 CFR Part 21, Appendix C(b)(3)), including resolution efforts.
- Annually reviews the airport’s Title VI plan and disseminates information throughout staff and the Airport Sponsor’s leadership.
- Coordinates data collection to evaluate whether racial or ethnic groups are unequally benefited or impacted by airport programs. The data will be regularly assessed and readily available upon request (49 CFR § 21.9(b) & (c)). Data collection methods will include optional demographic questions in: any airport customer satisfaction surveys undertaken in the future, customer complaints, airport event sign-in sheets, and bids/proposals for airport contracts, and other methods described in the airport Community Participation Plan (CPP).
- Maintains demographic data for members of appointed planning and advisory bodies for the airport. Identifies any disparities compared to the community. Provides information to the membership selecting official/committee, particularly when vacancies occur. Authority members are appointed by the Governor of the State of Florida, the Alachua County Commission and the City of Gainesville Commission.
- Maintains a copy of 49 CFR Part 21 for inspection by any person asking for it during normal working hours (49 CFR 21, Appendix C (b)(2)(i)).
The Coordinator has requested and received access to the Title VI portion of the FAA Civil Rights Connect System (https://faa.civilrightsconnect.com/).
5. Notice
49 CFR Part 21 Appendix C(b)(2)(ii)
NV will conspicuously display the FAA-provided Unlawful Discrimination Poster in all public areas on airport property, including those with pedestrian activity. The Coordinator ensures that these posters are visible, accessible,[2] and maintained. The poster template is available at https://www.faa.gov/about/office_org/headquarters_offices/acr/com_civ_support/non_disc_pr/ and a completed copy is attached. See Section 15 Appendix.
GNV has posted the above Title VI policy statement at its staff offices.
GNV will distribute this Title VI Plan among its employees and airport contractors, concessionaires, lessees, and tenants. This plan will be distributed by September 1, 2024 by posting on the airport’s website and notification to employees, tenants, and meeting attendees that the plan is available on the website.
Posters are displayed in the terminal and other areas on airport property, including the following public locations:
| Terminal/FBO/Concessions/ Other Locations |
Quantity in Pre-Security Area |
Quantity in Post-Security Area |
Additional Quantities |
| Terminal | 3 | 3 | |
| University Air Center (FBO) | 1 |
*There are no other buildings open to the public on airport property
Outreach to Affected Communities
The Communications office ensures that notices for public meetings reach all segments of the impacted community. The Title VI coordinator will identify the effective media platforms to share announcement and notices. Announcements are made on the Airport’s website and through general circulation newspapers (Gainesville Sun). The Communication office contacts leaders and representatives in Affected Communities directly to confirm effective media platforms to reach all Affected Communities[3] and provide important feedback on translated materials. The office maintains records of all such notices and the efforts made to reach each of the Affected Communities.
Detailed information on our public notice and outreach procedures is available in the GNV CPP. A copy of the CPP is available at Community Participation Plan. A copy of each CPP report completed since the last Title VI Plan will be attached to the CPP.
GNV will create a detailed CPP by August 15, 2024. A copy of the plan will be available at Community Participation Plan.
To ensure that the community is effectively informed of and able to participate in public hearings, the Communication office includes public notices translated into appropriate languages, including for any language spoken by a significant number or proportion of the Affected Community population that has limited English proficiency (LEP). Such social media postings and notices will include direction for obtaining an interpreter, free of charge, for public hearings. 28 CFR § 42.405(d). See Limited English Proficiency (LEP) Section.
6. Community Statistics
Title VI regulations require Federal grant recipients to know their community demographics. See 49 CFR § 21.9(b). By knowing this information, the GNV will be able to identify, understand, and engage with communities. In doing so, the GNV needs to know about communities eligible to be served, actually or potentially affected, benefited or burdened by GNV’s airport program.
GNV has identified the neighborhoods on the below chart as comprising the affected communities. Census data is not available for neighborhoods but is available for census tracts. Each neighborhood has been associated with a census tract using Census Bureau maps and information has been provided for the associated census tracts.
| Neighborhood | Census Tract |
| Brittany Estates | 19.02 |
| Carol Estates South | 4 |
| Cedar Grove II | 6 |
| Debra Heights | 4 |
| Duval Heights – Front Porch Fla | 6 |
| Eden Park at Ironwood | 19.02 |
| Greater Northeast Community | 5 |
| Grove Street | 3.01 |
| Ironwood | 19.02 |
| Lamplighter | 19.02 |
| Lewis Place at Ironwood | 19.02 |
| Northeast Neighbors | 5 |
| University of Florida | 9.01 and 9.02 |
| Cedar Grove | 6 |
| Ironwood Golf Course Village | 19.02 |
| Affected Communities[4] | Population |
| Census Tract 3.01 | 4,034 |
| Census Tract 4 | 5,526 |
| Census Tract 5 | 4,844 |
| Census Tract 6 | 5,881 |
| Census Tract 9.01 | 726 |
| Census Tract 9.02 | 51 |
| Census Tract 19.02 | 3,973 |
| Total | 25,035 |
Hereafter, the above communities will be referred to collectively as “the Affected Communities”.
We have identified the following facts about the Affected Communities:
Low Income Communities[5].
A low-income area is an identifiable group of persons living in geographic proximity, whose median household income is at or below the Department of Health and Human Services poverty guidelines. Pursuant to Executive Order 12898, “Federal Actions to Address Environmental Justice in Minority Populations and Low-Income Populations,” the Gainesville Alachua County Regional Airport Authority has collected information about affected and potentially affected low-income communities. According to Census Table S1701: Poverty Status in the Past 12 Months, the overall poverty level for Alachua County is approximately 20.2%. The poverty rate remains high compared with the rest of the State of Florida. The poverty rates for the specific Affected Communities are as follows:
| Affected Communities | Poverty Rate |
| Census Tract 3.01 | 22.7% |
| Census Tract 4 | 20.4% |
| Census Tract 5 | 21.6% |
| Census Tract 6 | 34.6% |
| Census Tract 9.01 | 21.7% |
| Census Tract 9.02 | 77.3% |
| Census Tract 19.02 | 41.5% |
Racial and Ethnic Communities.
Demographic data for race, color, and national origin was evaluated to identify racial and ethnic communities and populations in each Affected Community. The demographic composition by race, color, or national origin for the specific Affected Communities are as follows[6]:
| Affected Community: __Census Tract 3.01________
Total Affected Community Population: ___4,034_____ |
||
| Demographic Group within Affected Community | Number of People in Minority Group | Percent of Total Affected Community Population |
| White alone | 2,331 | 57.8% |
| Black or African American alone | 1,240 | 30.7% |
| American Indian or Alaska Native alone | 0 | 0.0% |
| Asian alone | 84 | 2.1% |
| Native Hawaiian or Other Pacific Islander alone | 0 | 0.0% |
| Some other race alone | 105 |
2.6% |
| Two or more races | 274 | 6.8% |
| Hispanic or Latino origin (of any race) | 279 | 6.9% |
| White alone, not Hispanic or Latino | 2,239 | 55.5% |
| Affected Community: __Census Tract 4_______
Total Affected Community Population: ___5,526_______ |
||
| Demographic Group within Affected Community | Number of People in Minority Group | Percent of Total Affected Community Population |
| White alone | 2,941 | 53.2% |
| Black or African American alone | 1,641 | 29.7% |
| American Indian or Alaska Native alone | 40 | 0.7% |
| Asian alone | 171 | 3.1% |
| Native Hawaiian or Other Pacific Islander alone | 25 | 0.5% |
| Some other race alone | 158 | 2.9% |
| Two or more races | 550 | 10.0% |
| Hispanic or Latino origin (of any race) | 525 | 9.5% |
| White alone, not Hispanic or Latino | 2,632 | 47.6% |
| Affected Community: __Census Tract 5________
Total Affected Community Population: ___ 4,844 _______ |
||
| Demographic Group within Affected Community | Number of People in Minority Group | Percent of Total Affected Community Population |
| White alone | 3,977 | 82.1% |
| Black or African American alone | 589 | 12.2% |
| American Indian or Alaska Native alone | 29 | 0.6% |
| Asian alone | 77 | 1.6% |
| Native Hawaiian or Other Pacific Islander alone | 0 | 0.0% |
| Some other race alone | 59 | 1.2% |
| Two or more races | 113 | 2.3% |
| Hispanic or Latino origin (of any race) | 294 | 6.1% |
| White alone, not Hispanic or Latino | 3,795 | 78.3% |
| Affected Community: __Census Tract 6________
Total Affected Community Population: ___5,881 _______ |
||
| Demographic Group within Affected Community | Number of People in Minority Group | Percent of Total Affected Community Population |
| White alone | 148 | 2.5% |
| Black or African American alone | 5,587 | 95.0% |
| American Indian or Alaska Native alone | 0 | 0.0% |
| Asian alone | 3 | 0.1% |
| Native Hawaiian or Other Pacific Islander alone | 0 | 0.0% |
| Some other race alone | 0 | 0.0% |
| Two or more races | 143 | 2.4% |
| Hispanic or Latino origin (of any race) | 41 | 0.7% |
| White alone, not Hispanic or Latino | 113 | 1.9% |
| Affected Community: __Census Tract 9.01________
Total Affected Community Population: ___642 ____ |
||
| Demographic Group within Affected Community | Number of People in Minority Group | Percent of Total Affected Community Population |
| White alone | 294 | 45.8% |
| Black or African American alone | 0 | 0.0% |
| American Indian or Alaska Native alone | 0 | 0.0% |
| Asian alone | 202 | 31.5% |
| Native Hawaiian or Other Pacific Islander alone | 6 | 0.9% |
| Some other race alone | 28 | 4.4% |
| Two or more races | 112 | 17.5% |
| Hispanic or Latino origin (of any race) | 121 | 18.9% |
| White alone, not Hispanic or Latino | 273 | 42.5% |
| Affected Community: __Census Tract 9.02________
Total Affected Community Population: ___66 ______ |
||
| Demographic Group within Affected Community | Number of People in Minority Group | Percent of Total Affected Community Population |
| White alone | 27 | 40.9% |
| Black or African American alone | 0 | 0.0% |
| American Indian or Alaska Native alone | 7 | 10.6% |
| Asian alone | 21 | 31.8% |
| Native Hawaiian or Other Pacific Islander alone | 0 | 0.0% |
| Some other race alone | 0 | 0.0% |
| Two or more races | 11 | 16.7% |
| Hispanic or Latino origin (of any race) | 15 | 22.7% |
| White alone, not Hispanic or Latino | 23 | 34.9% |
|
Affected Community: __Census Tract 19.02________ Total Affected Community Population: ___3,973 ______ |
||
| Demographic Group within Affected Community | Number of People in Minority Group | Percent of Total Affected Community Population |
| White alone | 1,485 | 37.4% |
| Black or African American alone | 2,297 | 57.8% |
| American Indian or Alaska Native alone | 59 | 1.5% |
| Asian alone | 0 | 0.0% |
| Native Hawaiian or Other Pacific Islander alone | 0 | 0.0% |
| Some other race alone | 0 | 0.0% |
| Two or more races | 132 | 3.3% |
| Hispanic or Latino origin (of any race) | 282 | 7.1% |
| White alone, not Hispanic or Latino | 1,277 | 32.1% |
| Affected Community: __All Tracts________
Total Affected Community Population: ___ 24,966____ |
||
| Demographic Group within Affected Community | Number of People in Minority Group | Percent of Total Affected Community Population |
| White alone | 11,203 | 44.9% |
| Black or African American alone | 11,354 | 45.5% |
| American Indian or Alaska Native alone | 135 | 0.5% |
| Asian alone | 558 | 2.2% |
| Native Hawaiian or Other Pacific Islander alone | 31 | 0.1% |
| Some other race alone | 350 | 1.4% |
| Two or more races | 1,335 | 4.2% |
| Hispanic or Latino origin (of any race) | 1,557 | 5.4% |
| White alone, not Hispanic or Latino | 10,352 | 41.5% |
Limited English Proficiency (LEP)
The goal of all language access planning and implementation is to ensure that GNV communicates effectively with limited English proficient (LEP) individuals. Effective language access requires self-assessment and planning. The next table lists non-English languages[7] that are spoken in LEP households in the Affected Communities. The data source is the Census Bureau American Community Survey.
The threshold we have used for identifying the languages with significant LEP populations is the DOT LEP Policy Guidance safe harbor threshold, which is 5% or 1,000, whichever is less.[8] The safe harbor for our community is 1,000. Please refer to the end of this document to find data for all languages in our community. Note that there are no languages that meet the safe harbor threshold for our affected communities. The language spoken by the largest LEP population for all affected communities combined who speak English less than very well is Spanish with a population of 306 in the Affected Communities and a margin of error of 326 combined. Even assuming the margin of error, this population does not meet the safe harbor threshold.
| Languages Spoken by LEP Population that Meet the Safe Harbor Threshold | Number | Margin of Error |
| None | +/- |
Census Table B16001: Language Spoken at Home by Ability to Speak English for the affected communities is included at the end of this plan for reference.
Frequency of contact with LEP individuals at the airport and airport-related activities (all languages):
| Languages Spoken by LEP Persons |
A few times a year |
Several times a month (13 to 51 days a year) |
At least once a week (52 to 364 days a year) |
Every day |
| Spanish |
X |
|||
We have reviewed data from public schools and from the county’s Title VI Program as well as Additional languages spoken by significant numbers of LEP persons in the County and local schools. [9]That data indicates that (in 2021):
- 37,719 speakers of languages other than English who reside in Alachua County (14% of the population)
- 5% Spanish speakers (ages 18-64)
- 4% speak Asian or Pacific Island languages
- According to the School Board of Alachua County, there are 800 non-English speaking children (ELL) in Alachua schools, 80+ families in migrant education with monolingual Spanish or indigenous speaking parents, and 80 Spanish-speaking out of school youth served by Migrant Education
- The Combined Communications Center for Alachua County received 397 requests for the language line between September 2020 and April 2021. The majority were Spanish speakers followed by Mandarin, Vietnamese, and Tagalog.
This information is updated annually[10] through checking the following resources:
| Data Sources for Languages Spoken in Affected Community | Website link to Data Source |
| U.S. Census Bureau | https://data.census.gov/table?q=S1601:%20Language%20Spoken%20at%20Home&g=1400000US12001000301,12001000400,12001000500,12001000600,12001000901,12001000902,12001001902 |
Beneficiary Diversity
Demographic information is collected from airport customers, attendees at community meetings, and businesses seeking opportunities at the airport, through voluntary disclosures. GNV will assess the frequency with which staff has or could possibly have contact with LEP persons by documenting requests for LEP assistance or materials, requests for language interpreters or translated material, and may include surveying public meeting attendees.
| Description of Beneficiary Demographic Information Collection Methods |
|
Staff and Advisory Board Diversity.
Demographic information is collected from airport employees through voluntary disclosures.
| Description of Employee and Advisory Board Demographic Information Collection Methods |
|
In addition, the website is available for translation into 26 different languages.
7. Potential or Known Community Impacts
Projects or services receiving federal financial assistance have the potential to touch so many aspects of American life. Thus, in general, no GNV activity can have a discriminatory disparate impact on the basis of race, color, national origin (including LEP), sex (including sexual orientation and gender identity), creed, or age. This means that policies or procedures that have a disparate impact would require a well-documented substantial legitimate nondiscriminatory justification, summarized below. Impacts to protected communities must be avoided or minimized to the extent possible. No project with a discriminatory impact on protected communities will be undertaken.[11]
The following airport facilities are already in use or under construction and expected to be in use within the next three years:
| Existing Airport Facilities | Affected Community Impacted by Operation of the Facility |
| Terminal | None |
| FBO | None |
Already in use or under construction and expected to be in use within the next 3 years:
The following airport facility projects (including all alternatives) are in construction or expected to be in construction within the next 3 years:
| Airport Facility Construction Projects | Affected Community Impacted by Construction of the Facility |
| None |
We have analyzed the above existing facilities and facility construction projects for disparate impacts on the basis of race, color, or national origin (including LEP) in Affected Communities. The following have disparate impacts:
| Facilities or Construction Projects with Disparate Impacts | Affected Community Impacted | Impact Can Be Eliminated? |
| None | N/A | N/A |
8. Limited English Proficiency (LEP)
Executive Order 13166
In creating a Language Assistance Plan, GNV will consider the volume, proportion, or frequency of contact with LEP persons in determining the appropriate language assistance to provide.
In Community Statistics section, we identified that no language met the safe harbor threshold. The largest LEP populate is Spanish speakers, however this group represents only 306 persons in the Affected Communities, which is approximately 1% of the population.
GNV also collects data for languages spoken by airport guests.[12] Data sources include:
| Data Sources for Languages Spoken by Airport Guests | Website link to Data Source |
| Assumption from flight origin / destination | N/A |
| Assistance requests to airport administrative office (located in the terminal) | N/A |
Based on the above data, the following additional languages have been identified as likely to be spoken by LEP airport guests:
| Language |
| None |
The Airport’s Public Information Officer will also actively engage with community educators, community groups, places of work, business groups, social groups, and the like to confirm that translation and interpretation services are accurate and effective. The Title VI Coordinator will inform leadership and staff of GNV of the responsibility to provide language access. We have made the following plans to provide translation services free of charge to ensure that individuals with LEP have access to the benefits of the airport:
Translation Services:
- The website contains the ability to translate to 26 different languages.
- In the event that translations services are requested, GNV will identify a vendor for translation. To date there have been no requests for translated materials.
- The following vendors have been identified for written translations:
| Translation Vendors | Languages |
| None | |
| Location for Translation Assistance | Languages |
| Website | 26 languages |
Interpretation Services:
- The following vendors have been identified for interpretation services:
| Interpretation Vendors | Languages |
| None |
| Description of Interpretation Assistance Processes |
|
9. Transportation
49 Part CFR 21 Appendix C (a)(1)(ix)
In the Community Statistics section of this plan, we identified Affected Communities and provided demographic and related data for the community populations. The minority and disadvantaged community areas located within the Affected Communities are identified below. Other minority and disadvantaged community areas that are near the airport but not within Affected Communities are also identified below.
The City of Gainesville Regional Transit System provides transit service access between the airport and these areas. RTS currently provides service through routes #25 (University of Florida Commuter Lot to the Airport) and #26 (Rosa Parks Transfer Station to the Airport). Service is approximately hourly from 6 am until 7 pm during the week (less frequently on the weekends and also has a reduced schedule in the summer).
The following chart identifies existing and planned transit services connecting the airport employment centers with the identified minority and disadvantaged community areas.
| Minority and/or Disadvantaged Community Areas | Transit Service | Planned or Existing |
| All Affected Communities | Fixed-route buses | Existing |
| All Affected Communities | Paratransit Services by Reservation | Existing |
10. Minority Businesses
49 CFR 21 Appendix C (a)(1)(x)
Bids for airport concessions and other business opportunities are solicited from area minority and woman-owned businesses through the following methods:
| Airport Business Opportunity | Minority Business Outreach Methods |
| RFQ 1 for Engineering Services | Website, General Circulation Newspaper (Gainesville Sun), Florida Administrative Register |
| RFQ 2 for Engineering Services | Website, General Circulation Newspaper (Gainesville Sun), Flordia Administrative Register |
Selections are in compliance with Title VI, Part 21, and related requirements. Information on the award process and documentation for specific bid decisions is kept with the Admin Office.
11. Training
New employee orientation incorporates Title VI training. Topics include:
- Title VI and related laws prohibit discrimination on the basis of race, color, national origin (including LEP), sex (including sexual orientation and gender identity), creed, or age
- Title VI complaints must be forwarded to the Coordinator
- Protections against retaliation for filing civil rights complaints or related actions
- Title VI notices must be displayed throughout the airport public facilities
- All contracts must include Title VI clauses
- Language interpretation and translation services
- Anti-harassment training
12. Compliance Reviews, Audits, Complaints, Lawsuits, and Other Investigations
FAA Notification. The Coordinator will notify FAA of any pending investigations and reviews, including:
- Compliance reviews or audits concerning civil rights requirements[13]
- Complaints, lawsuits, or other investigations alleging noncompliance with civil rights requirements[14]
As discussed in the Title VI Complaints Section, Title VI complaints must be forwarded to FAA contacts within 15 days of receipt. For all other civil rights investigations, GNV must notify FAA contacts of any new investigations prior to grant execution.
At regular intervals, the Coordinator will provide FAA contacts with status updates for the investigations and reviews, until completed. For each existing investigation or review completed within 5 years of this plan, the Coordinator will also provide a statement about the outcome, unless previously provided.
13. Title VI Complaints
49 CFR 21.11; 49 CFR 21 Appendix C (b)(3); 28 CFR 42.406(d)
Scope. These procedures are for complaints of discrimination under Title VI and related laws (hereafter “Title VI Complaints.” In order to be a Title VI Complaint, the complaint must:
- Allege discrimination on the basis of race, color, national origin (including LEP), sex (including sexual orientation and gender identity), creed, or age or violations administrative requirements under Title VI or related laws.
- Not only be for employment matters[15]
- Allege misconduct by GNV including airport employees, contractors, concessionaires, lessees, or tenants.
- Concern an airport facility or actions by GNV including airport employees, contractors, concessionaires, lessees, or tenants.
Rights. Any person who believes that he or she has been subjected to discrimination on the basis of race, color, national origin (including LEP), sex (including sexual orientation and gender identity), creed, or age has the right to file a complaint with the GNV. Alternatively, they can file a formal complaint with an outside agency, such as the U.S. Departments of Justice or Transportation, or the Federal Aviation Administration (FAA), or seek other legal remedies.
Receipt of Complaint. The Coordinator will log in the complaint and promptly send copies of the complaint to the office named in the complaint and to the Airport CEO.
Complaints must be filed within 180 days of the discriminatory event, must be in writing, and must be delivered to:
Lynn Noffsinger
Title VI Coordinator
Phone: (352) 373-0249 ext. 123
Address: 3880 NE 39th Ave, Suite A
Gainesville, FL 32609
Email: lynn.noffsinger@flygainesville.com
If a complaint is initially made by phone, it must be supplemented with a written complaint within 180 days after the discriminatory event has passed. If a verbal complaint is received, the complainant should be given a copy of the Airport Discrimination Complaint Procedures and instructed to submit a written complaint. Accommodation will be provided upon request to individuals unable to file a written complaint due to a disability.
Initial Procedure. The Coordinator may meet with the complainant to clarify the issues, obtain additional information, and determine if informal resolution might be possible in lieu of an investigation. If successfully resolved, the Coordinator will issue a closure letter to the complainant, record the disposition in the complaints log, and report the resolution to FAA.
Discrimination Complaint Referral Procedure
Internal Complaint Referral. All Title VI complaints must be promptly forwarded to the Coordinator within 1 business day.
Initial FAA Notification. A copy of each Title VI complaint will be forwarded to the FAA within 15 days of initial receipt. The Coordinator will forward a copy of the complaint and a statement describing all actions taken to resolve the matter, and the results thereof to the FAA Civil Rights staff. To transmit complaint information to the FAA, the Coordinator will upload the complaint to the FAA Civil Rights Connect System, which issues automated notifications to FAA staff. The Coordinator will also seek technical assistance from FAA, as needed, throughout complaint intake, investigation and resolution process.
Investigation Procedure
Assignment of Investigator. The Coordinator will immediately begin the investigation or designate an investigator.
Cooperation with FAA. The Coordinator will promptly investigate all Title VI complaints, including those referred by the FAA for investigation. If the FAA is investigating a complaint against GNV the Coordinator will avoid interfering with the FAA investigation, cooperate with the FAA when needed, and share factual information with the FAA.
Prompt Investigation. The Coordinator will make every effort to complete discrimination complaint investigations within 60 calendar days after the complaint is received. Some investigations may take longer with a justification for the delay and assurance that the investigation is being completed as quickly as possible.
Contact with Complainant. The Coordinator will meet with the complainant to clarify the issues and obtain additional information, and also speak with community members and potential witnesses, as appropriate.
Investigation Report. After completing the investigation, the Coordinator will prepare a written report.
Consultation with Legal Counsel. In each case, the Coordinator will consult with Legal Counsel regarding the investigation and the report. Airport Legal Counsel will ensure that the report is consistent with the DOT and FAA Title VI nondiscrimination requirements.
Prompt Resolution of Disputes. The Coordinator will emphasize voluntary compliance and quickly and fairly resolve disputes with complainants, or with contractors, tenants, or other persons, through negotiation.
Forwarding Report and Response to Complainant. At the completion of the investigation, the complainant and respondent will receive a letter of findings and determination of the investigation and any applicable resolution. The letter transmitting the findings, and any applicable resolution will state GNV’s conclusion regarding whether unlawful discrimination occurred and will describe the complainant’s appeal rights. A summary of the investigation report, any appeal, or follow-up actions will be sent to the FAA via the FAA Civil Rights Connect System.
Appeal Rights. The complainant must be notified of their right to appeal the findings or determinations, and of the procedures and requirements for an appeal:
- The complainant may appeal in writing to the Airport’s CEO.
- The written appeal must be received within 30 business days after receipt of the written decision.
- The written appeal must contain all arguments, evidence, and documents supporting the basis for the appeal.
- The CEO will issue a final written decision in response to the
Avoiding Future Discrimination. In addition to taking action with respect to any specific instances of discrimination, GNV will identify and implement measures to reduce the chances of similar discrimination in the future, including additional training as needed.
Intimidation and Retaliation Prohibited. GNV employees, contractors, and tenants will not intimidate or retaliate against a person who has filed a complaint alleging discrimination.
For information on filing a complaint with DOT/FAA, please contact:
Lynn Noffsinger
Title VI Coordinator
Phone: (352) 373-0249 ext. 123
Address: 3880 NE 39th Ave, Suite A
Gainesville, FL 32609
Email: lynn.noffsinger@flygainesville.com
This complaint procedure is shared with the public through the following methods:
| Website |
| www.flygainesville.com |
14. Population / Language Data
| B16001 | LANGUAGE SPOKEN AT HOME BY ABILITY TO SPEAK ENGLISH FOR THE POPULATION 5 YEARS AND OVER | Census Tract 3.01, Alachua County, Florida | Census Tract 4, Alachua County, Florida | Census Tract 5, Alachua County, Florida | Census Tract 6, Alachua County, Florida | Census Tract 9.01, Alachua County, Florida | Census Tract 9.02, Alachua County, Florida | Census Tract 19.02, Alachua County, Florida | |||||||
| Label | Estimate | Margin of Error | Estimate | Margin of Error | Estimate | Margin of Error | Estimate | Margin of Error | Estimate | Margin of Error | Estimate | Margin of Error | Estimate | Margin of Error |
| Total: | 3,195 | ±342 | 5,034 | ±645 | 4,808 | ±631 | 3,795 | ±443 | 4,751 | ±942 | 6,542 | ±499 | 2,751 | ±943 |
| Speak only English | 2,990 | ±330 | 4,631 | ±665 | 4,329 | ±615 | 3,621 | ±436 | 3,544 | ±700 | 5,399 | ±397 | 2,605 | ±942 |
| Spanish or Spanish Creole: | 93 | ±69 | 350 | ±227 | 303 | ±145 | 94 | ±109 | 501 | ±178 | 533 | ±132 | 80 | ±65 |
| Speak English “very well” | 83 | ±68 | 194 | ±127 | 288 | ±141 | 77 | ±98 | 458 | ±174 | 504 | ±126 | 44 | ±48 |
| Speak English less than “very well” | 10 | ±17 | 156 | ±158 | 15 | ±22 | 17 | ±29 | 43 | ±31 | 29 | ±24 | 36 | ±45 |
| French (incl. Patois, Cajun): | 19 | ±30 | 29 | ±49 | 16 | ±26 | 7 | ±11 | 14 | ±13 | 39 | ±31 | 0 | ±13 |
| Speak English “very well” | 19 | ±30 | 29 | ±49 | 16 | ±26 | 0 | ±13 | 14 | ±13 | 39 | ±31 | 0 | ±13 |
| Speak English less than “very well” | 0 | ±13 | 0 | ±19 | 0 | ±13 | 7 | ±11 | 0 | ±13 | 0 | ±19 | 0 | ±13 |
| French Creole: | 0 | ±13 | 0 | ±19 | 0 | ±13 | 0 | ±13 | 27 | ±31 | 20 | ±22 | 6 | ±12 |
| Speak English “very well” | 0 | ±13 | 0 | ±19 | 0 | ±13 | 0 | ±13 | 27 | ±31 | 20 | ±22 | 6 | ±12 |
| Speak English less than “very well” | 0 | ±13 | 0 | ±19 | 0 | ±13 | 0 | ±13 | 0 | ±13 | 0 | ±19 | 0 | ±13 |
| Italian: | 0 | ±13 | 0 | ±19 | 0 | ±13 | 0 | ±13 | 7 | ±13 | 0 | ±19 | 0 | ±13 |
| Speak English “very well” | 0 | ±13 | 0 | ±19 | 0 | ±13 | 0 | ±13 | 7 | ±13 | 0 | ±19 | 0 | ±13 |
| Speak English less than “very well” | 0 | ±13 | 0 | ±19 | 0 | ±13 | 0 | ±13 | 0 | ±13 | 0 | ±19 | 0 | ±13 |
| Portuguese or Portuguese Creole: | 0 | ±13 | 0 | ±19 | 0 | ±13 | 23 | ±37 | 36 | ±27 | 25 | ±20 | 0 | ±13 |
| Speak English “very well” | 0 | ±13 | 0 | ±19 | 0 | ±13 | 23 | ±37 | 32 | ±23 | 25 | ±20 | 0 | ±13 |
| Speak English less than “very well” | 0 | ±13 | 0 | ±19 | 0 | ±13 | 0 | ±13 | 4 | ±8 | 0 | ±19 | 0 | ±13 |
| German: | 0 | ±13 | 12 | ±21 | 20 | ±32 | 7 | ±12 | 31 | ±28 | 18 | ±21 | 0 | ±13 |
| Speak English “very well” | 0 | ±13 | 0 | ±19 | 20 | ±32 | 0 | ±13 | 31 | ±28 | 14 | ±20 | 0 | ±13 |
| Speak English less than “very well” | 0 | ±13 | 12 | ±21 | 0 | ±13 | 7 | ±12 | 0 | ±13 | 4 | ±9 | 0 | ±13 |
| Yiddish: | 0 | ±13 | 0 | ±19 | 0 | ±13 | 0 | ±13 | 0 | ±13 | 0 | ±19 | 0 | ±13 |
| Speak English “very well” | 0 | ±13 | 0 | ±19 | 0 | ±13 | 0 | ±13 | 0 | ±13 | 0 | ±19 | 0 | ±13 |
| Speak English less than “very well” | 0 | ±13 | 0 | ±19 | 0 | ±13 | 0 | ±13 | 0 | ±13 | 0 | ±19 | 0 | ±13 |
| Other West Germanic languages: | 0 | ±13 | 0 | ±19 | 17 | ±27 | 0 | ±13 | 0 | ±13 | 10 | ±20 | 0 | ±13 |
| Speak English “very well” | 0 | ±13 | 0 | ±19 | 17 | ±27 | 0 | ±13 | 0 | ±13 | 10 | ±20 | 0 | ±13 |
| Speak English less than “very well” | 0 | ±13 | 0 | ±19 | 0 | ±13 | 0 | ±13 | 0 | ±13 | 0 | ±19 | 0 | ±13 |
| Scandinavian languages: | 0 | ±13 | 0 | ±19 | 0 | ±13 | 0 | ±13 | 6 | ±11 | 7 | ±10 | 0 | ±13 |
| Speak English “very well” | 0 | ±13 | 0 | ±19 | 0 | ±13 | 0 | ±13 | 0 | ±13 | 2 | ±4 | 0 | ±13 |
| Speak English less than “very well” | 0 | ±13 | 0 | ±19 | 0 | ±13 | 0 | ±13 | 6 | ±11 | 5 | ±9 | 0 | ±13 |
| Greek: | 0 | ±13 | 0 | ±19 | 0 | ±13 | 0 | ±13 | 14 | ±27 | 0 | ±19 | 0 | ±13 |
| Speak English “very well” | 0 | ±13 | 0 | ±19 | 0 | ±13 | 0 | ±13 | 14 | ±27 | 0 | ±19 | 0 | ±13 |
| Speak English less than “very well” | 0 | ±13 | 0 | ±19 | 0 | ±13 | 0 | ±13 | 0 | ±13 | 0 | ±19 | 0 | ±13 |
| Russian: | 0 | ±13 | 0 | ±19 | 0 | ±13 | 0 | ±13 | 0 | ±13 | 48 | ±45 | 0 | ±13 |
| Speak English “very well” | 0 | ±13 | 0 | ±19 | 0 | ±13 | 0 | ±13 | 0 | ±13 | 29 | ±37 | 0 | ±13 |
| Speak English less than “very well” | 0 | ±13 | 0 | ±19 | 0 | ±13 | 0 | ±13 | 0 | ±13 | 19 | ±26 | 0 | ±13 |
| Polish: | 0 | ±13 | 0 | ±19 | 0 | ±13 | 0 | ±13 | 6 | ±9 | 0 | ±19 | 9 | ±15 |
| Speak English “very well” | 0 | ±13 | 0 | ±19 | 0 | ±13 | 0 | ±13 | 2 | ±4 | 0 | ±19 | 0 | ±13 |
| Speak English less than “very well” | 0 | ±13 | 0 | ±19 | 0 | ±13 | 0 | ±13 | 4 | ±8 | 0 | ±19 | 9 | ±15 |
| Serbo-Croatian: | 0 | ±13 | 0 | ±19 | 49 | ±56 | 0 | ±13 | 0 | ±13 | 0 | ±19 | 0 | ±13 |
| Speak English “very well” | 0 | ±13 | 0 | ±19 | 49 | ±56 | 0 | ±13 | 0 | ±13 | 0 | ±19 | 0 | ±13 |
| Speak English less than “very well” | 0 | ±13 | 0 | ±19 | 0 | ±13 | 0 | ±13 | 0 | ±13 | 0 | ±19 | 0 | ±13 |
| Other Slavic languages: | 7 | ±12 | 0 | ±19 | 0 | ±13 | 0 | ±13 | 0 | ±13 | 11 | ±22 | 0 | ±13 |
| Speak English “very well” | 7 | ±12 | 0 | ±19 | 0 | ±13 | 0 | ±13 | 0 | ±13 | 11 | ±22 | 0 | ±13 |
| Speak English less than “very well” | 0 | ±13 | 0 | ±19 | 0 | ±13 | 0 | ±13 | 0 | ±13 | 0 | ±19 | 0 | ±13 |
| Armenian: | 0 | ±13 | 0 | ±19 | 0 | ±13 | 0 | ±13 | 0 | ±13 | 18 | ±27 | 0 | ±13 |
| Speak English “very well” | 0 | ±13 | 0 | ±19 | 0 | ±13 | 0 | ±13 | 0 | ±13 | 18 | ±27 | 0 | ±13 |
| Speak English less than “very well” | 0 | ±13 | 0 | ±19 | 0 | ±13 | 0 | ±13 | 0 | ±13 | 0 | ±19 | 0 | ±13 |
| Persian: | 16 | ±26 | 0 | ±19 | 59 | ±89 | 0 | ±13 | 61 | ±81 | 17 | ±19 | 0 | ±13 |
| Speak English “very well” | 0 | ±13 | 0 | ±19 | 59 | ±89 | 0 | ±13 | 52 | ±80 | 17 | ±19 | 0 | ±13 |
| Speak English less than “very well” | 16 | ±26 | 0 | ±19 | 0 | ±13 | 0 | ±13 | 9 | ±11 | 0 | ±19 | 0 | ±13 |
| Gujarati: | 0 | ±13 | 0 | ±19 | 0 | ±13 | 0 | ±13 | 11 | ±22 | 12 | ±19 | 0 | ±13 |
| Speak English “very well” | 0 | ±13 | 0 | ±19 | 0 | ±13 | 0 | ±13 | 11 | ±22 | 12 | ±19 | 0 | ±13 |
| Speak English less than “very well” | 0 | ±13 | 0 | ±19 | 0 | ±13 | 0 | ±13 | 0 | ±13 | 0 | ±19 | 0 | ±13 |
| Hindi: | 0 | ±13 | 0 | ±19 | 0 | ±13 | 0 | ±13 | 24 | ±23 | 0 | ±19 | 0 | ±13 |
| Speak English “very well” | 0 | ±13 | 0 | ±19 | 0 | ±13 | 0 | ±13 | 20 | ±20 | 0 | ±19 | 0 | ±13 |
| Speak English less than “very well” | 0 | ±13 | 0 | ±19 | 0 | ±13 | 0 | ±13 | 4 | ±7 | 0 | ±19 | 0 | ±13 |
| Urdu: | 0 | ±13 | 0 | ±19 | 0 | ±13 | 0 | ±13 | 9 | ±14 | 8 | ±16 | 0 | ±13 |
| Speak English “very well” | 0 | ±13 | 0 | ±19 | 0 | ±13 | 0 | ±13 | 9 | ±14 | 8 | ±16 | 0 | ±13 |
| Speak English less than “very well” | 0 | ±13 | 0 | ±19 | 0 | ±13 | 0 | ±13 | 0 | ±13 | 0 | ±19 | 0 | ±13 |
| Other Indic languages: | 0 | ±13 | 12 | ±18 | 0 | ±13 | 0 | ±13 | 71 | ±68 | 23 | ±23 | 0 | ±13 |
| Speak English “very well” | 0 | ±13 | 12 | ±18 | 0 | ±13 | 0 | ±13 | 30 | ±27 | 23 | ±23 | 0 | ±13 |
| Speak English less than “very well” | 0 | ±13 | 0 | ±19 | 0 | ±13 | 0 | ±13 | 41 | ±64 | 0 | ±19 | 0 | ±13 |
| Other Indo-European languages: | 0 | ±13 | 0 | ±19 | 0 | ±13 | 0 | ±13 | 5 | ±11 | 29 | ±29 | 0 | ±13 |
| Speak English “very well” | 0 | ±13 | 0 | ±19 | 0 | ±13 | 0 | ±13 | 5 | ±11 | 29 | ±29 | 0 | ±13 |
| Speak English less than “very well” | 0 | ±13 | 0 | ±19 | 0 | ±13 | 0 | ±13 | 0 | ±13 | 0 | ±19 | 0 | ±13 |
| Chinese: | 31 | ±36 | 0 | ±19 | 0 | ±13 | 0 | ±13 | 215 | ±98 | 146 | ±57 | 0 | ±13 |
| Speak English “very well” | 31 | ±36 | 0 | ±19 | 0 | ±13 | 0 | ±13 | 122 | ±90 | 131 | ±56 | 0 | ±13 |
| Speak English less than “very well” | 0 | ±13 | 0 | ±19 | 0 | ±13 | 0 | ±13 | 93 | ±40 | 15 | ±16 | 0 | ±13 |
| Japanese: | 0 | ±13 | 0 | ±19 | 0 | ±13 | 0 | ±13 | 0 | ±13 | 6 | ±12 | 0 | ±13 |
| Speak English “very well” | 0 | ±13 | 0 | ±19 | 0 | ±13 | 0 | ±13 | 0 | ±13 | 6 | ±12 | 0 | ±13 |
| Speak English less than “very well” | 0 | ±13 | 0 | ±19 | 0 | ±13 | 0 | ±13 | 0 | ±13 | 0 | ±19 | 0 | ±13 |
| Korean: | 0 | ±13 | 0 | ±19 | 0 | ±13 | 0 | ±13 | 26 | ±22 | 16 | ±19 | 0 | ±13 |
| Speak English “very well” | 0 | ±13 | 0 | ±19 | 0 | ±13 | 0 | ±13 | 7 | ±14 | 16 | ±19 | 0 | ±13 |
| Speak English less than “very well” | 0 | ±13 | 0 | ±19 | 0 | ±13 | 0 | ±13 | 19 | ±17 | 0 | ±19 | 0 | ±13 |
| Mon-Khmer, Cambodian: | 0 | ±13 | 0 | ±19 | 0 | ±13 | 0 | ±13 | 0 | ±13 | 0 | ±19 | 0 | ±13 |
| Speak English “very well” | 0 | ±13 | 0 | ±19 | 0 | ±13 | 0 | ±13 | 0 | ±13 | 0 | ±19 | 0 | ±13 |
| Speak English less than “very well” | 0 | ±13 | 0 | ±19 | 0 | ±13 | 0 | ±13 | 0 | ±13 | 0 | ±19 | 0 | ±13 |
| Hmong: | 0 | ±13 | 0 | ±19 | 0 | ±13 | 0 | ±13 | 0 | ±13 | 0 | ±19 | 0 | ±13 |
| Speak English “very well” | 0 | ±13 | 0 | ±19 | 0 | ±13 | 0 | ±13 | 0 | ±13 | 0 | ±19 | 0 | ±13 |
| Speak English less than “very well” | 0 | ±13 | 0 | ±19 | 0 | ±13 | 0 | ±13 | 0 | ±13 | 0 | ±19 | 0 | ±13 |
| Thai: | 0 | ±13 | 0 | ±19 | 0 | ±13 | 0 | ±13 | 0 | ±13 | 7 | ±14 | 0 | ±13 |
| Speak English “very well” | 0 | ±13 | 0 | ±19 | 0 | ±13 | 0 | ±13 | 0 | ±13 | 7 | ±14 | 0 | ±13 |
| Speak English less than “very well” | 0 | ±13 | 0 | ±19 | 0 | ±13 | 0 | ±13 | 0 | ±13 | 0 | ±19 | 0 | ±13 |
| Laotian: | 0 | ±13 | 0 | ±19 | 0 | ±13 | 0 | ±13 | 0 | ±13 | 0 | ±19 | 0 | ±13 |
| Speak English “very well” | 0 | ±13 | 0 | ±19 | 0 | ±13 | 0 | ±13 | 0 | ±13 | 0 | ±19 | 0 | ±13 |
| Speak English less than “very well” | 0 | ±13 | 0 | ±19 | 0 | ±13 | 0 | ±13 | 0 | ±13 | 0 | ±19 | 0 | ±13 |
| Vietnamese: | 0 | ±13 | 0 | ±19 | 0 | ±13 | 14 | ±21 | 37 | ±43 | 33 | ±31 | 0 | ±13 |
| Speak English “very well” | 0 | ±13 | 0 | ±19 | 0 | ±13 | 14 | ±21 | 28 | ±40 | 33 | ±31 | 0 | ±13 |
| Speak English less than “very well” | 0 | ±13 | 0 | ±19 | 0 | ±13 | 0 | ±13 | 9 | ±16 | 0 | ±19 | 0 | ±13 |
| Other Asian languages: | 0 | ±13 | 0 | ±19 | 0 | ±13 | 0 | ±13 | 50 | ±42 | 18 | ±23 | 0 | ±13 |
| Speak English “very well” | 0 | ±13 | 0 | ±19 | 0 | ±13 | 0 | ±13 | 19 | ±24 | 5 | ±12 | 0 | ±13 |
| Speak English less than “very well” | 0 | ±13 | 0 | ±19 | 0 | ±13 | 0 | ±13 | 31 | ±33 | 13 | ±20 | 0 | ±13 |
| Tagalog: | 22 | ±26 | 0 | ±19 | 0 | ±13 | 0 | ±13 | 17 | ±26 | 17 | ±26 | 51 | ±49 |
| Speak English “very well” | 10 | ±15 | 0 | ±19 | 0 | ±13 | 0 | ±13 | 17 | ±26 | 17 | ±26 | 38 | ±34 |
| Speak English less than “very well” | 12 | ±21 | 0 | ±19 | 0 | ±13 | 0 | ±13 | 0 | ±13 | 0 | ±19 | 13 | ±20 |
| Other Pacific Island languages: | 0 | ±13 | 0 | ±19 | 0 | ±13 | 0 | ±13 | 25 | ±39 | 0 | ±19 | 0 | ±13 |
| Speak English “very well” | 0 | ±13 | 0 | ±19 | 0 | ±13 | 0 | ±13 | 11 | ±18 | 0 | ±19 | 0 | ±13 |
| Speak English less than “very well” | 0 | ±13 | 0 | ±19 | 0 | ±13 | 0 | ±13 | 14 | ±22 | 0 | ±19 | 0 | ±13 |
| Navajo: | 0 | ±13 | 0 | ±19 | 0 | ±13 | 0 | ±13 | 0 | ±13 | 0 | ±19 | 0 | ±13 |
| Speak English “very well” | 0 | ±13 | 0 | ±19 | 0 | ±13 | 0 | ±13 | 0 | ±13 | 0 | ±19 | 0 | ±13 |
| Speak English less than “very well” | 0 | ±13 | 0 | ±19 | 0 | ±13 | 0 | ±13 | 0 | ±13 | 0 | ±19 | 0 | ±13 |
| Other Native North American languages: | 0 | ±13 | 0 | ±19 | 0 | ±13 | 0 | ±13 | 0 | ±13 | 0 | ±19 | 0 | ±13 |
| Speak English “very well” | 0 | ±13 | 0 | ±19 | 0 | ±13 | 0 | ±13 | 0 | ±13 | 0 | ±19 | 0 | ±13 |
| Speak English less than “very well” | 0 | ±13 | 0 | ±19 | 0 | ±13 | 0 | ±13 | 0 | ±13 | 0 | ±19 | 0 | ±13 |
| Hungarian: | 0 | ±13 | 0 | ±19 | 0 | ±13 | 0 | ±13 | 0 | ±13 | 12 | ±25 | 0 | ±13 |
| Speak English “very well” | 0 | ±13 | 0 | ±19 | 0 | ±13 | 0 | ±13 | 0 | ±13 | 12 | ±25 | 0 | ±13 |
| Speak English less than “very well” | 0 | ±13 | 0 | ±19 | 0 | ±13 | 0 | ±13 | 0 | ±13 | 0 | ±19 | 0 | ±13 |
| Arabic: | 0 | ±13 | 0 | ±19 | 0 | ±13 | 0 | ±13 | 2 | ±4 | 40 | ±40 | 0 | ±13 |
| Speak English “very well” | 0 | ±13 | 0 | ±19 | 0 | ±13 | 0 | ±13 | 2 | ±4 | 40 | ±40 | 0 | ±13 |
| Speak English less than “very well” | 0 | ±13 | 0 | ±19 | 0 | ±13 | 0 | ±13 | 0 | ±13 | 0 | ±19 | 0 | ±13 |
| Hebrew: | 0 | ±13 | 0 | ±19 | 0 | ±13 | 0 | ±13 | 12 | ±16 | 17 | ±24 | 0 | ±13 |
| Speak English “very well” | 0 | ±13 | 0 | ±19 | 0 | ±13 | 0 | ±13 | 12 | ±16 | 17 | ±24 | 0 | ±13 |
| Speak English less than “very well” | 0 | ±13 | 0 | ±19 | 0 | ±13 | 0 | ±13 | 0 | ±13 | 0 | ±19 | 0 | ±13 |
| African languages: | 17 | ±19 | 0 | ±19 | 0 | ±13 | 29 | ±45 | 0 | ±13 | 13 | ±18 | 0 | ±13 |
| Speak English “very well” | 17 | ±19 | 0 | ±19 | 0 | ±13 | 29 | ±45 | 0 | ±13 | 13 | ±18 | 0 | ±13 |
| Speak English less than “very well” | 0 | ±13 | 0 | ±19 | 0 | ±13 | 0 | ±13 | 0 | ±13 | 0 | ±19 | 0 | ±13 |
| Other and unspecified languages: | 0 | ±13 | 0 | ±19 | 15 | ±23 | 0 | ±13 | 0 | ±13 | 0 | ±19 | 0 | ±13 |
| Speak English “very well” | 0 | ±13 | 0 | ±19 | 15 | ±23 | 0 | ±13 | 0 | ±13 | 0 | ±19 | 0 | ±13 |
| Speak English less than “very well” | 0 | ±13 | 0 | ±19 | 0 | ±13 | 0 | ±13 | 0 | ±13 | 0 | ±19 | 0 | ±13 |
| S1701 | Poverty Status in the Past 12 Months | Census Tract 3.01; Alachua County; Florida | Census Tract 4; Alachua County; Florida | ||||||||||
| Total | Below poverty level | Percent below poverty level | Total | Below poverty level | Percent below poverty level | |||||||
| Label | Estimate | Margin of Error | Estimate | Margin of Error | Estimate | Margin of Error | Estimate | Margin of Error | Estimate | Margin of Error | Estimate | Margin of Error |
| Population for whom poverty status is determined | 4,034 | ±986 | 914 | ±354 | 22.7% | ±9.7 | 5,526 | ±1,014 | 1,130 | ±604 | 20.4% | ±9.8 |
| AGE | ||||||||||||
| Under 18 years | 872 | ±544 | 121 | ±181 | 13.9% | ±21.1 | 1,381 | ±493 | 566 | ±325 | 41.0% | ±18.9 |
| Under 5 years | 64 | ±57 | 26 | ±38 | 40.6% | ±51.6 | 180 | ±217 | 124 | ±194 | 68.9% | ±41.6 |
| 5 to 17 years | 808 | ±551 | 95 | ±144 | 11.8% | ±18.8 | 1,201 | ±399 | 442 | ±233 | 36.8% | ±18.5 |
| Related children of householder under 18 years | 872 | ±544 | 121 | ±181 | 13.9% | ±21.1 | 1,381 | ±493 | 566 | ±325 | 41.0% | ±18.9 |
| 18 to 64 years | 2,754 | ±565 | 710 | ±258 | 25.8% | ±9.3 | 3,447 | ±769 | 374 | ±312 | 10.9% | ±8.7 |
| 18 to 34 years | 1,713 | ±526 | 571 | ±249 | 33.3% | ±13.5 | 1,807 | ±753 | 214 | ±260 | 11.8% | ±13.3 |
| 35 to 64 years | 1,041 | ±312 | 139 | ±102 | 13.4% | ±9.5 | 1,640 | ±357 | 160 | ±153 | 9.8% | ±9.0 |
| 60 years and over | 595 | ±164 | 143 | ±97 | 24.0% | ±14.9 | 991 | ±261 | 206 | ±115 | 20.8% | ±11.2 |
| 65 years and over | 408 | ±131 | 83 | ±78 | 20.3% | ±17.2 | 698 | ±181 | 190 | ±105 | 27.2% | ±13.6 |
| SEX | ||||||||||||
| Male | 2,136 | ±598 | 398 | ±230 | 18.6% | ±10.4 | 2,464 | ±494 | 441 | ±290 | 17.9% | ±10.8 |
| Female | 1,898 | ±584 | 516 | ±207 | 27.2% | ±13.1 | 3,062 | ±778 | 689 | ±548 | 22.5% | ±14.2 |
| RACE AND HISPANIC OR LATINO ORIGIN | ||||||||||||
| White alone | 2,331 | ±698 | 474 | ±200 | 20.3% | ±9.9 | 2,941 | ±760 | 84 | ±88 | 2.9% | ±3.2 |
| Black or African American alone | 1,240 | ±709 | 186 | ±205 | 15.0% | ±20.2 | 1,641 | ±673 | 767 | ±564 | 46.7% | ±21.5 |
| American Indian and Alaska Native alone | 0 | ±15 | 0 | ±15 | – | ** | 40 | ±37 | 0 | ±21 | 0.0% | ±58.2 |
| Asian alone | 84 | ±107 | 84 | ±107 | 100.0% | ±40.1 | 171 | ±207 | 33 | ±55 | 19.3% | ±40.4 |
| Native Hawaiian and Other Pacific Islander alone | 0 | ±15 | 0 | ±15 | – | ** | 25 | ±35 | 0 | ±21 | 0.0% | ±73.6 |
| Some other race alone | 105 | ±123 | 92 | ±121 | 87.6% | ±29.6 | 158 | ±212 | 12 | ±22 | 7.6% | ±20.5 |
| Two or more races | 274 | ±151 | 78 | ±72 | 28.5% | ±21.7 | 550 | ±212 | 234 | ±148 | 42.5% | ±23.6 |
| Hispanic or Latino origin (of any race) | 279 | ±164 | 196 | ±147 | 70.3% | ±24.4 | 525 | ±294 | 39 | ±39 | 7.4% | ±8.4 |
| White alone, not Hispanic or Latino | 2,239 | ±697 | 382 | ±187 | 17.1% | ±9.4 | 2,632 | ±712 | 83 | ±88 | 3.2% | ±3.6 |
| EDUCATIONAL ATTAINMENT | ||||||||||||
| Population 25 years and over | 2,503 | ±501 | 383 | ±168 | 15.3% | ±7.5 | 3,936 | ±788 | 444 | ±216 | 11.3% | ±6.1 |
| Less than high school graduate | 23 | ±32 | 9 | ±20 | 39.1% | ±60.0 | 399 | ±222 | 211 | ±176 | 52.9% | ±27.4 |
| High school graduate (includes equivalency) | 597 | ±209 | 130 | ±91 | 21.8% | ±16.3 | 871 | ±261 | 103 | ±68 | 11.8% | ±8.9 |
| Some college, associate’s degree | 883 | ±368 | 108 | ±77 | 12.2% | ±9.3 | 1,058 | ±382 | 76 | ±107 | 7.2% | ±10.2 |
| Bachelor’s degree or higher | 1,000 | ±290 | 136 | ±80 | 13.6% | ±8.6 | 1,608 | ±475 | 54 | ±66 | 3.4% | ±4.1 |
| EMPLOYMENT STATUS | ||||||||||||
| Civilian labor force 16 years and over | 2,263 | ±458 | 430 | ±186 | 19.0% | ±8.3 | 2,958 | ±768 | 281 | ±273 | 9.5% | ±8.8 |
| Employed | 2,124 | ±455 | 291 | ±143 | 13.7% | ±7.0 | 2,698 | ±708 | 127 | ±129 | 4.7% | ±5.0 |
| Male | 1,170 | ±320 | 94 | ±67 | 8.0% | ±6.0 | 1,013 | ±311 | 47 | ±67 | 4.6% | ±6.8 |
| Female | 954 | ±248 | 197 | ±116 | 20.6% | ±12.3 | 1,685 | ±473 | 80 | ±105 | 4.7% | ±6.5 |
| Unemployed | 139 | ±103 | 139 | ±103 | 100.0% | ±29.4 | 260 | ±209 | 154 | ±182 | 59.2% | ±36.7 |
| Male | 49 | ±59 | 49 | ±59 | 100.0% | ±52.5 | 90 | ±102 | 0 | ±21 | 0.0% | ±38.8 |
| Female | 90 | ±83 | 90 | ±83 | 100.0% | ±38.8 | 170 | ±173 | 154 | ±182 | 90.6% | ±22.9 |
| WORK EXPERIENCE | ||||||||||||
| Population 16 years and over | 3,168 | ±581 | 793 | ±282 | 25.0% | ±8.7 | 4,208 | ±787 | 564 | ±304 | 13.4% | ±7.2 |
| Worked full-time, year-round in the past 12 months | 1,468 | ±398 | 83 | ±67 | 5.7% | ±5.1 | 1,701 | ±495 | 26 | ±51 | 1.5% | ±3.0 |
| Worked part-time or part-year in the past 12 months | 866 | ±268 | 351 | ±175 | 40.5% | ±15.1 | 1,252 | ±427 | 201 | ±238 | 16.1% | ±16.8 |
| Did not work | 834 | ±284 | 359 | ±153 | 43.0% | ±17.7 | 1,255 | ±309 | 337 | ±195 | 26.9% | ±13.8 |
| ALL INDIVIDUALS WITH INCOME BELOW THE FOLLOWING POVERTY RATIOS | ||||||||||||
| 50 percent of poverty level | 568 | ±260 | (X) | (X) | (X) | (X) | 664 | ±475 | (X) | (X) | (X) | (X) |
| 125 percent of poverty level | 1,049 | ±387 | (X) | (X) | (X) | (X) | 1,297 | ±603 | (X) | (X) | (X) | (X) |
| 150 percent of poverty level | 1,121 | ±385 | (X) | (X) | (X) | (X) | 1,716 | ±639 | (X) | (X) | (X) | (X) |
| 185 percent of poverty level | 2,014 | ±777 | (X) | (X) | (X) | (X) | 1,992 | ±682 | (X) | (X) | (X) | (X) |
| 200 percent of poverty level | 2,282 | ±774 | (X) | (X) | (X) | (X) | 2,191 | ±689 | (X) | (X) | (X) | (X) |
| 300 percent of poverty level | 3,240 | ±1,004 | (X) | (X) | (X) | (X) | 3,514 | ±932 | (X) | (X) | (X) | (X) |
| 400 percent of poverty level | 3,706 | ±1,013 | (X) | (X) | (X) | (X) | 4,459 | ±1,004 | (X) | (X) | (X) | (X) |
| 500 percent of poverty level | 3,829 | ±990 | (X) | (X) | (X) | (X) | 4,855 | ±1,006 | (X) | (X) | (X) | (X) |
| UNRELATED INDIVIDUALS FOR WHOM POVERTY STATUS IS DETERMINED | 1,996 | ±315 | 693 | ±247 | 34.7% | ±9.3 | 1,180 | ±613 | 185 | ±116 | 15.7% | ±13.2 |
| Male | 971 | ±224 | 256 | ±168 | 26.4% | ±14.3 | 457 | ±271 | 98 | ±84 | 21.4% | ±21.7 |
| Female | 1,025 | ±247 | 437 | ±182 | 42.6% | ±12.5 | 723 | ±378 | 87 | ±84 | 12.0% | ±13.0 |
| 15 years | 0 | ±15 | 0 | ±15 | – | ** | 0 | ±21 | 0 | ±21 | – | ** |
| 16 to 17 years | 0 | ±15 | 0 | ±15 | – | ** | 0 | ±21 | 0 | ±21 | – | ** |
| 18 to 24 years | 575 | ±258 | 410 | ±227 | 71.3% | ±17.1 | 33 | ±55 | 33 | ±55 | 100.0% | ±64.0 |
| 25 to 34 years | 652 | ±226 | 140 | ±69 | 21.5% | ±11.1 | 603 | ±589 | 21 | ±36 | 3.5% | ±8.9 |
| 35 to 44 years | 204 | ±111 | 0 | ±15 | 0.0% | ±21.5 | 41 | ±49 | 0 | ±21 | 0.0% | ±57.4 |
| 45 to 54 years | 72 | ±71 | 44 | ±63 | 61.1% | ±49.3 | 77 | ±77 | 3 | ±6 | 3.9% | ±9.6 |
| 55 to 64 years | 222 | ±120 | 60 | ±64 | 27.0% | ±26.3 | 67 | ±59 | 1 | ±7 | 1.5% | ±13.4 |
| 65 to 74 years | 176 | ±82 | 23 | ±29 | 13.1% | ±15.1 | 269 | ±122 | 68 | ±62 | 25.3% | ±20.4 |
| 75 years and over | 95 | ±70 | 16 | ±28 | 16.8% | ±30.1 | 90 | ±84 | 59 | ±79 | 65.6% | ±42.0 |
| Mean income deficit for unrelated individuals (dollars) | 9,728 | ±1,317 | (X) | (X) | (X) | (X) | 4,208 | ±1,933 | (X) | (X) | (X) | (X) |
| Worked full-time, year-round in the past 12 months | 822 | ±204 | 36 | ±42 | 4.4% | ±5.1 | 636 | ±377 | 0 | ±21 | 0.0% | ±7.6 |
| Worked less than full-time, year-round in the past 12 months | 652 | ±229 | 351 | ±175 | 53.8% | ±15.5 | 321 | ±265 | 92 | ±90 | 28.7% | ±34.4 |
| Did not work | 522 | ±166 | 306 | ±132 | 58.6% | ±16.0 | 223 | ±127 | 93 | ±86 | 41.7% | ±24.5 |
| Population in housing units for whom poverty status is determined | 4,002 | ±985 | 907 | ±354 | 22.7% | ±9.7 | 5,511 | ±1,014 | 1,121 | ±602 | 20.3% | ±9.8 |
| S1701 | Poverty Status in the Past 12 Months | Census Tract 5; Alachua County; Florida | Census Tract 6; Alachua County; Florida | ||||||||||
| Total | Below poverty level | Percent below poverty level | Total | Below poverty level | Percent below poverty level | |||||||
| Label | Estimate | Margin of Error | Estimate | Margin of Error | Estimate | Margin of Error | Estimate | Margin of Error | Estimate | Margin of Error | Estimate | Margin of Error |
| Population for whom poverty status is determined | 4,844 | ±836 | 1,046 | ±631 | 21.6% | ±10.4 | 5,881 | ±789 | 2,034 | ±634 | 34.6% | ±9.4 |
| AGE | ||||||||||||
| Under 18 years | 707 | ±308 | 308 | ±312 | 43.6% | ±33.0 | 2,130 | ±484 | 974 | ±403 | 45.7% | ±15.4 |
| Under 5 years | 155 | ±113 | 29 | ±43 | 18.7% | ±27.6 | 892 | ±324 | 562 | ±321 | 63.0% | ±20.5 |
| 5 to 17 years | 552 | ±278 | 279 | ±292 | 50.5% | ±36.8 | 1,238 | ±337 | 412 | ±246 | 33.3% | ±17.2 |
| Related children of householder under 18 years | 707 | ±308 | 308 | ±312 | 43.6% | ±33.0 | 2,130 | ±484 | 974 | ±403 | 45.7% | ±15.4 |
| 18 to 64 years | 3,593 | ±623 | 664 | ±350 | 18.5% | ±7.8 | 3,068 | ±400 | 985 | ±348 | 32.1% | ±9.5 |
| 18 to 34 years | 1,570 | ±388 | 241 | ±211 | 15.4% | ±11.4 | 1,546 | ±279 | 481 | ±173 | 31.1% | ±9.8 |
| 35 to 64 years | 2,023 | ±435 | 423 | ±239 | 20.9% | ±9.8 | 1,522 | ±299 | 504 | ±304 | 33.1% | ±16.0 |
| 60 years and over | 773 | ±197 | 112 | ±133 | 14.5% | ±14.9 | 1,116 | ±349 | 277 | ±274 | 24.8% | ±21.8 |
| 65 years and over | 544 | ±139 | 74 | ±70 | 13.6% | ±13.5 | 683 | ±226 | 75 | ±47 | 11.0% | ±7.5 |
| SEX | ||||||||||||
| Male | 2,295 | ±579 | 486 | ±318 | 21.2% | ±10.5 | 2,460 | ±426 | 928 | ±343 | 37.7% | ±11.1 |
| Female | 2,549 | ±410 | 560 | ±347 | 22.0% | ±11.8 | 3,421 | ±532 | 1,106 | ±410 | 32.3% | ±10.4 |
| RACE AND HISPANIC OR LATINO ORIGIN | ||||||||||||
| White alone | 3,977 | ±791 | 796 | ±577 | 20.0% | ±11.6 | 148 | ±72 | 23 | ±15 | 15.5% | ±11.2 |
| Black or African American alone | 589 | ±313 | 227 | ±214 | 38.5% | ±30.4 | 5,587 | ±824 | 1,975 | ±641 | 35.3% | ±10.0 |
| American Indian and Alaska Native alone | 29 | ±45 | 0 | ±15 | 0.0% | ±68.3 | 0 | ±21 | 0 | ±21 | – | ** |
| Asian alone | 77 | ±70 | 0 | ±15 | 0.0% | ±41.9 | 3 | ±7 | 0 | ±21 | 0.0% | ±100.0 |
| Native Hawaiian and Other Pacific Islander alone | 0 | ±15 | 0 | ±15 | – | ** | 0 | ±21 | 0 | ±21 | – | ** |
| Some other race alone | 59 | ±74 | 11 | ±18 | 18.6% | ±42.5 | 0 | ±21 | 0 | ±21 | – | ** |
| Two or more races | 113 | ±101 | 12 | ±23 | 10.6% | ±21.7 | 143 | ±78 | 36 | ±26 | 25.2% | ±19.8 |
| Hispanic or Latino origin (of any race) | 294 | ±134 | 79 | ±79 | 26.9% | ±21.4 | 41 | ±44 | 2 | ±5 | 4.9% | ±13.6 |
| White alone, not Hispanic or Latino | 3,795 | ±793 | 722 | ±575 | 19.0% | ±12.2 | 113 | ±53 | 22 | ±15 | 19.5% | ±12.3 |
| EDUCATIONAL ATTAINMENT | ||||||||||||
| Population 25 years and over | 3,305 | ±476 | 513 | ±256 | 15.5% | ±6.9 | 3,118 | ±413 | 826 | ±317 | 26.5% | ±9.3 |
| Less than high school graduate | 5 | ±9 | 5 | ±9 | 100.0% | ±100.0 | 609 | ±232 | 343 | ±191 | 56.3% | ±19.6 |
| High school graduate (includes equivalency) | 470 | ±171 | 130 | ±112 | 27.7% | ±25.6 | 1,185 | ±297 | 209 | ±156 | 17.6% | ±13.3 |
| Some college, associate’s degree | 643 | ±273 | 155 | ±132 | 24.1% | ±20.3 | 974 | ±278 | 209 | ±116 | 21.5% | ±10.6 |
| Bachelor’s degree or higher | 2,187 | ±365 | 223 | ±178 | 10.2% | ±7.9 | 350 | ±133 | 65 | ±65 | 18.6% | ±16.3 |
| EMPLOYMENT STATUS | ||||||||||||
| Civilian labor force 16 years and over | 3,157 | ±587 | 427 | ±342 | 13.5% | ±9.2 | 2,105 | ±378 | 475 | ±203 | 22.6% | ±8.9 |
| Employed | 3,032 | ±617 | 326 | ±325 | 10.8% | ±9.1 | 1,762 | ±315 | 296 | ±158 | 16.8% | ±8.7 |
| Male | 1,590 | ±474 | 150 | ±165 | 9.4% | ±8.5 | 746 | ±197 | 138 | ±126 | 18.5% | ±14.9 |
| Female | 1,442 | ±274 | 176 | ±169 | 12.2% | ±10.8 | 1,016 | ±216 | 158 | ±86 | 15.6% | ±8.9 |
| Unemployed | 125 | ±145 | 101 | ±145 | 80.8% | ±75.1 | 343 | ±168 | 179 | ±127 | 52.2% | ±28.5 |
| Male | 125 | ±145 | 101 | ±145 | 80.8% | ±75.1 | 95 | ±82 | 64 | ±66 | 67.4% | ±44.3 |
| Female | 0 | ±15 | 0 | ±15 | – | ** | 248 | ±156 | 115 | ±114 | 46.4% | ±34.8 |
| WORK EXPERIENCE | ||||||||||||
| Population 16 years and over | 4,176 | ±612 | 738 | ±357 | 17.7% | ±7.0 | 3,975 | ±497 | 1,087 | ±359 | 27.3% | ±8.5 |
| Worked full-time, year-round in the past 12 months | 1,856 | ±353 | 7 | ±13 | 0.4% | ±0.7 | 1,346 | ±297 | 144 | ±87 | 10.7% | ±6.8 |
| Worked part-time or part-year in the past 12 months | 1,348 | ±483 | 392 | ±320 | 29.1% | ±18.0 | 675 | ±236 | 276 | ±176 | 40.9% | ±19.1 |
| Did not work | 972 | ±245 | 339 | ±170 | 34.9% | ±14.7 | 1,954 | ±356 | 667 | ±231 | 34.1% | ±11.6 |
| ALL INDIVIDUALS WITH INCOME BELOW THE FOLLOWING POVERTY RATIOS | ||||||||||||
| 50 percent of poverty level | 351 | ±254 | (X) | (X) | (X) | (X) | 1,000 | ±447 | (X) | (X) | (X) | (X) |
| 125 percent of poverty level | 1,098 | ±633 | (X) | (X) | (X) | (X) | 2,526 | ±670 | (X) | (X) | (X) | (X) |
| 150 percent of poverty level | 1,301 | ±657 | (X) | (X) | (X) | (X) | 3,226 | ±761 | (X) | (X) | (X) | (X) |
| 185 percent of poverty level | 1,784 | ±734 | (X) | (X) | (X) | (X) | 3,866 | ±782 | (X) | (X) | (X) | (X) |
| 200 percent of poverty level | 1,861 | ±741 | (X) | (X) | (X) | (X) | 3,901 | ±781 | (X) | (X) | (X) | (X) |
| 300 percent of poverty level | 2,559 | ±875 | (X) | (X) | (X) | (X) | 5,025 | ±785 | (X) | (X) | (X) | (X) |
| 400 percent of poverty level | 3,018 | ±887 | (X) | (X) | (X) | (X) | 5,516 | ±810 | (X) | (X) | (X) | (X) |
| 500 percent of poverty level | 3,541 | ±854 | (X) | (X) | (X) | (X) | 5,653 | ±798 | (X) | (X) | (X) | (X) |
| UNRELATED INDIVIDUALS FOR WHOM POVERTY STATUS IS DETERMINED | 2,327 | ±386 | 481 | ±187 | 20.7% | ±7.0 | 675 | ±187 | 225 | ±93 | 33.3% | ±11.4 |
| Male | 1,108 | ±313 | 257 | ±122 | 23.2% | ±10.1 | 253 | ±94 | 99 | ±66 | 39.1% | ±22.5 |
| Female | 1,219 | ±245 | 224 | ±139 | 18.4% | ±10.2 | 422 | ±169 | 126 | ±75 | 29.9% | ±11.4 |
| 15 years | 0 | ±15 | 0 | ±15 | – | ** | 0 | ±21 | 0 | ±21 | – | ** |
| 16 to 17 years | 0 | ±15 | 0 | ±15 | – | ** | 0 | ±21 | 0 | ±21 | – | ** |
| 18 to 24 years | 541 | ±229 | 131 | ±146 | 24.2% | ±24.5 | 2 | ±5 | 2 | ±5 | 100.0% | ±100.0 |
| 25 to 34 years | 575 | ±216 | 11 | ±18 | 1.9% | ±3.2 | 169 | ±115 | 85 | ±67 | 50.3% | ±20.8 |
| 35 to 44 years | 604 | ±362 | 156 | ±158 | 25.8% | ±22.2 | 108 | ±68 | 62 | ±66 | 57.4% | ±41.3 |
| 45 to 54 years | 190 | ±139 | 79 | ±97 | 41.6% | ±41.9 | 80 | ±53 | 39 | ±38 | 48.8% | ±33.6 |
| 55 to 64 years | 230 | ±132 | 46 | ±110 | 20.0% | ±33.3 | 130 | ±90 | 5 | ±8 | 3.8% | ±7.4 |
| 65 to 74 years | 169 | ±101 | 40 | ±63 | 23.7% | ±32.2 | 102 | ±56 | 0 | ±21 | 0.0% | ±36.2 |
| 75 years and over | 18 | ±24 | 18 | ±24 | 100.0% | ±86.7 | 84 | ±56 | 32 | ±33 | 38.1% | ±31.4 |
| Mean income deficit for unrelated individuals (dollars) | 6,974 | ±2,892 | (X) | (X) | (X) | (X) | 9,104 | ±2,441 | (X) | (X) | (X) | (X) |
| Worked full-time, year-round in the past 12 months | 1,201 | ±290 | 7 | ±13 | 0.6% | ±1.1 | 195 | ±92 | 11 | ±17 | 5.6% | ±8.9 |
| Worked less than full-time, year-round in the past 12 months | 674 | ±340 | 172 | ±160 | 25.5% | ±18.2 | 85 | ±65 | 49 | ±49 | 57.6% | ±36.2 |
| Did not work | 452 | ±179 | 302 | ±160 | 66.8% | ±19.3 | 395 | ±137 | 165 | ±78 | 41.8% | ±17.3 |
| Population in housing units for whom poverty status is determined | 4,723 | ±836 | 941 | ±632 | 19.9% | ±10.8 | 5,860 | ±789 | 2,015 | ±635 | 34.4% | ±9.4 |
| S1701 | Poverty Status in the Past 12 Months | Census Tract 9.01; Alachua County; Florida | Census Tract 9.02; Alachua County; Florida | ||||||||||
| Total | Below poverty level | Percent below poverty level | Total | Below poverty level | Percent below poverty level | |||||||
| Label | Estimate | Margin of Error | Estimate | Margin of Error | Estimate | Margin of Error | Estimate | Margin of Error | Estimate | Margin of Error | Estimate | Margin of Error |
| Population for whom poverty status is determined | 642 | ±193 | 139 | ±81 | 21.7% | ±11.4 | 66 | ±35 | 51 | ±34 | 77.3% | ±22.8 |
| AGE | ||||||||||||
| Under 18 years | 120 | ±59 | 21 | ±23 | 17.5% | ±18.4 | 0 | ±21 | 0 | ±21 | – | ** |
| Under 5 years | 76 | ±41 | 21 | ±23 | 27.6% | ±28.1 | 0 | ±21 | 0 | ±21 | – | ** |
| 5 to 17 years | 44 | ±42 | 0 | ±15 | 0.0% | ±55.5 | 0 | ±21 | 0 | ±21 | – | ** |
| Related children of householder under 18 years | 120 | ±59 | 21 | ±23 | 17.5% | ±18.4 | 0 | ±21 | 0 | ±21 | – | ** |
| 18 to 64 years | 522 | ±173 | 118 | ±72 | 22.6% | ±12.0 | 66 | ±35 | 51 | ±34 | 77.3% | ±22.8 |
| 18 to 34 years | 297 | ±127 | 63 | ±37 | 21.2% | ±13.1 | 54 | ±35 | 44 | ±33 | 81.5% | ±23.6 |
| 35 to 64 years | 225 | ±113 | 55 | ±65 | 24.4% | ±21.4 | 12 | ±13 | 7 | ±10 | 58.3% | ±58.3 |
| 60 years and over | 0 | ±15 | 0 | ±15 | – | ** | 0 | ±21 | 0 | ±21 | – | ** |
| 65 years and over | 0 | ±15 | 0 | ±15 | – | ** | 0 | ±21 | 0 | ±21 | – | ** |
| SEX | ||||||||||||
| Male | 307 | ±110 | 52 | ±41 | 16.9% | ±12.9 | 32 | ±29 | 21 | ±26 | 65.6% | ±45.6 |
| Female | 335 | ±116 | 87 | ±70 | 26.0% | ±15.6 | 34 | ±25 | 30 | ±25 | 88.2% | ±19.8 |
| RACE AND HISPANIC OR LATINO ORIGIN | ||||||||||||
| White alone | 294 | ±126 | 40 | ±37 | 13.6% | ±11.8 | 27 | ±27 | 22 | ±26 | 81.5% | ±37.2 |
| Black or African American alone | 0 | ±15 | 0 | ±15 | – | ** | 0 | ±21 | 0 | ±21 | – | ** |
| American Indian and Alaska Native alone | 0 | ±15 | 0 | ±15 | – | ** | 7 | ±10 | 7 | ±10 | 100.0% | ±100.0 |
| Asian alone | 202 | ±90 | 37 | ±30 | 18.3% | ±15.1 | 21 | ±21 | 15 | ±18 | 71.4% | ±45.9 |
| Native Hawaiian and Other Pacific Islander alone | 6 | ±9 | 0 | ±15 | 0.0% | ±100.0 | 0 | ±21 | 0 | ±21 | – | ** |
| Some other race alone | 28 | ±41 | 0 | ±15 | 0.0% | ±69.5 | 0 | ±21 | 0 | ±21 | – | ** |
| Two or more races | 112 | ±106 | 62 | ±67 | 55.4% | ±44.2 | 11 | ±11 | 7 | ±12 | 63.6% | ±63.0 |
| Hispanic or Latino origin (of any race) | 121 | ±106 | 54 | ±64 | 44.6% | ±38.5 | 15 | ±13 | 11 | ±12 | 73.3% | ±40.6 |
| White alone, not Hispanic or Latino | 273 | ±128 | 40 | ±37 | 14.7% | ±12.9 | 23 | ±27 | 18 | ±26 | 78.3% | ±45.6 |
| EDUCATIONAL ATTAINMENT | ||||||||||||
| Population 25 years and over | 458 | ±166 | 85 | ±69 | 18.6% | ±12.6 | 41 | ±26 | 26 | ±22 | 63.4% | ±30.5 |
| Less than high school graduate | 15 | ±22 | 0 | ±15 | 0.0% | ±95.0 | 0 | ±21 | 0 | ±21 | – | ** |
| High school graduate (includes equivalency) | 7 | ±11 | 7 | ±11 | 100.0% | ±100.0 | 0 | ±21 | 0 | ±21 | – | ** |
| Some college, associate’s degree | 74 | ±56 | 8 | ±12 | 10.8% | ±15.8 | 0 | ±21 | 0 | ±21 | – | ** |
| Bachelor’s degree or higher | 362 | ±141 | 70 | ±69 | 19.3% | ±14.9 | 41 | ±26 | 26 | ±22 | 63.4% | ±30.5 |
| EMPLOYMENT STATUS | ||||||||||||
| Civilian labor force 16 years and over | 342 | ±120 | 47 | ±38 | 13.7% | ±10.3 | 29 | ±19 | 14 | ±15 | 48.3% | ±37.5 |
| Employed | 337 | ±120 | 47 | ±38 | 13.9% | ±10.5 | 29 | ±19 | 14 | ±15 | 48.3% | ±37.5 |
| Male | 222 | ±94 | 34 | ±31 | 15.3% | ±13.9 | 14 | ±14 | 3 | ±5 | 21.4% | ±33.6 |
| Female | 115 | ±57 | 13 | ±21 | 11.3% | ±16.6 | 15 | ±14 | 11 | ±14 | 73.3% | ±44.3 |
| Unemployed | 5 | ±9 | 0 | ±15 | 0.0% | ±100.0 | 0 | ±21 | 0 | ±21 | – | ** |
| Male | 0 | ±15 | 0 | ±15 | – | ** | 0 | ±21 | 0 | ±21 | – | ** |
| Female | 5 | ±9 | 0 | ±15 | 0.0% | ±100.0 | 0 | ±21 | 0 | ±21 | – | ** |
| WORK EXPERIENCE | ||||||||||||
| Population 16 years and over | 522 | ±173 | 118 | ±72 | 22.6% | ±12.0 | 66 | ±35 | 51 | ±34 | 77.3% | ±22.8 |
| Worked full-time, year-round in the past 12 months | 183 | ±108 | 21 | ±22 | 11.5% | ±10.7 | 9 | ±11 | 0 | ±21 | 0.0% | ±100.0 |
| Worked part-time or part-year in the past 12 months | 199 | ±73 | 34 | ±31 | 17.1% | ±13.9 | 38 | ±30 | 32 | ±29 | 84.2% | ±28.1 |
| Did not work | 140 | ±79 | 63 | ±61 | 45.0% | ±25.2 | 19 | ±20 | 19 | ±20 | 100.0% | ±84.4 |
| ALL INDIVIDUALS WITH INCOME BELOW THE FOLLOWING POVERTY RATIOS | ||||||||||||
| 50 percent of poverty level | 78 | ±66 | (X) | (X) | (X) | (X) | 37 | ±31 | (X) | (X) | (X) | (X) |
| 125 percent of poverty level | 259 | ±121 | (X) | (X) | (X) | (X) | 51 | ±34 | (X) | (X) | (X) | (X) |
| 150 percent of poverty level | 295 | ±130 | (X) | (X) | (X) | (X) | 57 | ±35 | (X) | (X) | (X) | (X) |
| 185 percent of poverty level | 383 | ±137 | (X) | (X) | (X) | (X) | 57 | ±35 | (X) | (X) | (X) | (X) |
| 200 percent of poverty level | 474 | ±171 | (X) | (X) | (X) | (X) | 61 | ±35 | (X) | (X) | (X) | (X) |
| 300 percent of poverty level | 593 | ±194 | (X) | (X) | (X) | (X) | 61 | ±35 | (X) | (X) | (X) | (X) |
| 400 percent of poverty level | 638 | ±193 | (X) | (X) | (X) | (X) | 66 | ±35 | (X) | (X) | (X) | (X) |
| 500 percent of poverty level | 642 | ±193 | (X) | (X) | (X) | (X) | 66 | ±35 | (X) | (X) | (X) | (X) |
| UNRELATED INDIVIDUALS FOR WHOM POVERTY STATUS IS DETERMINED | 205 | ±95 | 91 | ±72 | 44.4% | ±19.2 | 66 | ±35 | 51 | ±34 | 77.3% | ±22.8 |
| Male | 86 | ±47 | 25 | ±29 | 29.1% | ±29.2 | 32 | ±29 | 21 | ±26 | 65.6% | ±45.6 |
| Female | 119 | ±79 | 66 | ±68 | 55.5% | ±23.3 | 34 | ±25 | 30 | ±25 | 88.2% | ±19.8 |
| 15 years | 0 | ±15 | 0 | ±15 | – | ** | 0 | ±21 | 0 | ±21 | – | ** |
| 16 to 17 years | 0 | ±15 | 0 | ±15 | – | ** | 0 | ±21 | 0 | ±21 | – | ** |
| 18 to 24 years | 50 | ±40 | 33 | ±32 | 66.0% | ±41.6 | 25 | ±28 | 25 | ±28 | 100.0% | ±73.6 |
| 25 to 34 years | 73 | ±32 | 10 | ±11 | 13.7% | ±13.1 | 29 | ±25 | 19 | ±20 | 65.5% | ±36.1 |
| 35 to 44 years | 82 | ±81 | 48 | ±66 | 58.5% | ±34.9 | 7 | ±10 | 7 | ±10 | 100.0% | ±100.0 |
| 45 to 54 years | 0 | ±15 | 0 | ±15 | – | ** | 5 | ±8 | 0 | ±21 | 0.0% | ±100.0 |
| 55 to 64 years | 0 | ±15 | 0 | ±15 | – | ** | 0 | ±21 | 0 | ±21 | – | ** |
| 65 to 74 years | 0 | ±15 | 0 | ±15 | – | ** | 0 | ±21 | 0 | ±21 | – | ** |
| 75 years and over | 0 | ±15 | 0 | ±15 | – | ** | 0 | ±21 | 0 | ±21 | – | ** |
| Mean income deficit for unrelated individuals (dollars) | N | N | (X) | (X) | (X) | (X) | N | N | (X) | (X) | (X) | (X) |
| Worked full-time, year-round in the past 12 months | 74 | ±56 | 13 | ±21 | 17.6% | ±18.8 | 9 | ±11 | 0 | ±21 | 0.0% | ±100.0 |
| Worked less than full-time, year-round in the past 12 months | 73 | ±40 | 27 | ±30 | 37.0% | ±28.3 | 38 | ±30 | 32 | ±29 | 84.2% | ±28.1 |
| Did not work | 58 | ±61 | 51 | ±61 | 87.9% | ±21.7 | 19 | ±20 | 19 | ±20 | 100.0% | ±84.4 |
| Population in housing units for whom poverty status is determined | 642 | ±193 | 139 | ±81 | 21.7% | ±11.4 | 66 | ±35 | 51 | ±34 | 77.3% | ±22.8 |
| S1701 | Poverty Status in the Past 12 Months | Census Tract 19.02; Alachua County; Florida | |||||
| Total | Below poverty level | Percent below poverty level | ||||
| Label | Estimate | Margin of Error | Estimate | Margin of Error | Estimate | Margin of Error |
| Population for whom poverty status is determined | 3,973 | ±725 | 1,648 | ±689 | 41.5% | ±14.1 |
| AGE | ||||||
| Under 18 years | 594 | ±243 | 394 | ±247 | 66.3% | ±22.8 |
| Under 5 years | 190 | ±127 | 123 | ±120 | 64.7% | ±39.4 |
| 5 to 17 years | 404 | ±206 | 271 | ±200 | 67.1% | ±27.4 |
| Related children of householder under 18 years | 594 | ±243 | 394 | ±247 | 66.3% | ±22.8 |
| 18 to 64 years | 2,410 | ±678 | 1,028 | ±478 | 42.7% | ±15.6 |
| 18 to 34 years | 1,002 | ±458 | 344 | ±270 | 34.3% | ±24.7 |
| 35 to 64 years | 1,408 | ±435 | 684 | ±277 | 48.6% | ±12.1 |
| 60 years and over | 1,316 | ±316 | 452 | ±184 | 34.3% | ±16.4 |
| 65 years and over | 969 | ±369 | 226 | ±131 | 23.3% | ±14.3 |
| SEX | ||||||
| Male | 2,129 | ±476 | 867 | ±375 | 40.7% | ±14.8 |
| Female | 1,844 | ±583 | 781 | ±397 | 42.4% | ±15.9 |
| RACE AND HISPANIC OR LATINO ORIGIN | ||||||
| White alone | 1,485 | ±266 | 666 | ±289 | 44.8% | ±17.3 |
| Black or African American alone | 2,297 | ±749 | 885 | ±591 | 38.5% | ±19.1 |
| American Indian and Alaska Native alone | 59 | ±54 | 0 | ±15 | 0.0% | ±47.9 |
| Asian alone | 0 | ±15 | 0 | ±15 | – | ** |
| Native Hawaiian and Other Pacific Islander alone | 0 | ±15 | 0 | ±15 | – | ** |
| Some other race alone | 0 | ±15 | 0 | ±15 | – | ** |
| Two or more races | 132 | ±115 | 97 | ±122 | 73.5% | ±39.0 |
| Hispanic or Latino origin (of any race) | 282 | ±229 | 222 | ±201 | 78.7% | ±18.6 |
| White alone, not Hispanic or Latino | 1,277 | ±228 | 498 | ±238 | 39.0% | ±18.3 |
| EDUCATIONAL ATTAINMENT | ||||||
| Population 25 years and over | 2,967 | ±368 | 1,071 | ±401 | 36.1% | ±12.7 |
| Less than high school graduate | 948 | ±527 | 312 | ±151 | 32.9% | ±15.9 |
| High school graduate (includes equivalency) | 716 | ±279 | 184 | ±150 | 25.7% | ±19.8 |
| Some college, associate’s degree | 967 | ±332 | 442 | ±251 | 45.7% | ±15.1 |
| Bachelor’s degree or higher | 336 | ±237 | 133 | ±135 | 39.6% | ±22.4 |
| EMPLOYMENT STATUS | ||||||
| Civilian labor force 16 years and over | 1,860 | ±565 | 571 | ±379 | 30.7% | ±16.4 |
| Employed | 1,689 | ±486 | 453 | ±267 | 26.8% | ±13.6 |
| Male | 765 | ±276 | 185 | ±151 | 24.2% | ±17.6 |
| Female | 924 | ±396 | 268 | ±234 | 29.0% | ±19.5 |
| Unemployed | 171 | ±183 | 118 | ±183 | 69.0% | ±54.7 |
| Male | 160 | ±183 | 118 | ±183 | 73.8% | ±54.0 |
| Female | 11 | ±18 | 0 | ±15 | 0.0% | ±100.0 |
| WORK EXPERIENCE | ||||||
| Population 16 years and over | 3,414 | ±577 | 1,289 | ±503 | 37.8% | ±13.5 |
| Worked full-time, year-round in the past 12 months | 1,075 | ±410 | 187 | ±175 | 17.4% | ±15.1 |
| Worked part-time or part-year in the past 12 months | 898 | ±352 | 486 | ±311 | 54.1% | ±21.0 |
| Did not work | 1,441 | ±277 | 616 | ±279 | 42.7% | ±18.7 |
| ALL INDIVIDUALS WITH INCOME BELOW THE FOLLOWING POVERTY RATIOS | ||||||
| 50 percent of poverty level | 760 | ±510 | (X) | (X) | (X) | (X) |
| 125 percent of poverty level | 2,085 | ±652 | (X) | (X) | (X) | (X) |
| 150 percent of poverty level | 2,421 | ±639 | (X) | (X) | (X) | (X) |
| 185 percent of poverty level | 2,835 | ±605 | (X) | (X) | (X) | (X) |
| 200 percent of poverty level | 2,883 | ±606 | (X) | (X) | (X) | (X) |
| 300 percent of poverty level | 3,626 | ±736 | (X) | (X) | (X) | (X) |
| 400 percent of poverty level | 3,813 | ±727 | (X) | (X) | (X) | (X) |
| 500 percent of poverty level | 3,945 | ±728 | (X) | (X) | (X) | (X) |
| UNRELATED INDIVIDUALS FOR WHOM POVERTY STATUS IS DETERMINED | 1,751 | ±184 | 677 | ±273 | 38.7% | ±16.7 |
| Male | 1,074 | ±400 | 392 | ±225 | 36.5% | ±18.5 |
| Female | 677 | ±362 | 285 | ±164 | 42.1% | ±21.9 |
| 15 years | 0 | ±15 | 0 | ±15 | – | ** |
| 16 to 17 years | 0 | ±15 | 0 | ±15 | – | ** |
| 18 to 24 years | 0 | ±15 | 0 | ±15 | – | ** |
| 25 to 34 years | 138 | ±127 | 72 | ±115 | 52.2% | ±52.2 |
| 35 to 44 years | 238 | ±166 | 55 | ±74 | 23.1% | ±29.2 |
| 45 to 54 years | 221 | ±174 | 101 | ±77 | 45.7% | ±22.6 |
| 55 to 64 years | 386 | ±206 | 267 | ±130 | 69.2% | ±26.0 |
| 65 to 74 years | 536 | ±348 | 131 | ±98 | 24.4% | ±12.7 |
| 75 years and over | 232 | ±87 | 51 | ±104 | 22.0% | ±44.9 |
| Mean income deficit for unrelated individuals (dollars) | 8,684 | ±1,778 | (X) | (X) | (X) | (X) |
| Worked full-time, year-round in the past 12 months | 344 | ±187 | 59 | ±124 | 17.2% | ±32.3 |
| Worked less than full-time, year-round in the past 12 months | 336 | ±217 | 111 | ±167 | 33.0% | ±37.3 |
| Did not work | 1,071 | ±268 | 507 | ±261 | 47.3% | ±22.9 |
| Population in housing units for whom poverty status is determined | 2,937 | ±720 | 1,138 | ±638 | 38.7% | ±16.4 |
15. Completed Unlawful Discrimination Poster
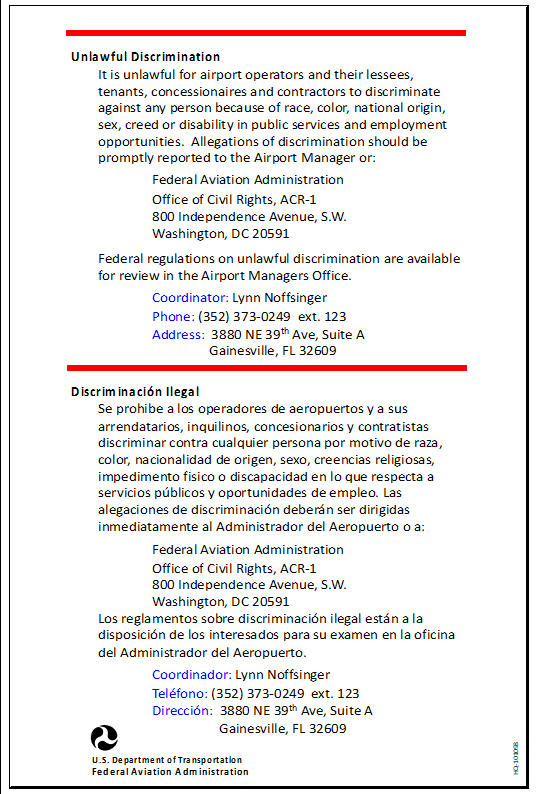
Footnotes:
[1] This policy statement will be translated into languages other than English, upon request and based on patron and local language demographics.
[2] For more information about website accessibility, please visit ADA.gov.
[3] We will not subject any persons to discrimination based on race, color, national origin, age, sex, or creed. The term “protected communities” is used within this Title VI Plan to highlight the requirements of Title VI, 49 U.S.C. § 47123, the Age Discrimination Act of 1975, and in some instances, includes low-income populations under Executive Order 12898.
[4] “Affected communities” means any readily identifiable group potentially impacted by an airport project or operation, such as the community immediately surrounding a project or a community in the flight path.
[5] Low-income data must be collected to assist in our compliance with Environmental Justice requirements (not Title VI requirements). For example, this data will be utilized in our Community Participation Plan (CPP) to help ensure the meaningful involvement of low income communities in airport programs and activities.
[6] Using demographic groups from the U.S. Census.
[7] Using language groups from the U.S. Census and using data for the “Speak English less than ‘very well’” category for each language over the threshold.
[8] See the DOT LEP Policy Guidance at https://www.federalregister.gov/d/05-23972/p-133. The safe harbor provisions apply to the translation of written documents only; however, it provides a consistent starting point for identifying significant LEP populations.
[9] Alachua County Title VI Plan
[10] Data should be kept up-to-date, but this plan does not need to be updated for incremental data changes during the Plan’s 3-year period.
[11] In order to carry out an alternative with a discriminatory impact, the airport sponsor must demonstrate that there was a substantial legitimate justification for the decision. The sponsor must also show that alternatives with less discriminatory impacts were meaningfully considered and rejected for legitimate reasons.
[12] We aim to provide appropriate language assistance services to every LEP person encountered. This includes instances when LEP statistical data for a particular language was not available beforehand, or the safe harbor threshold for written translation was not met.
[13] Includes any Title VI, ADA, Sec. 504, Title VII/EEO, or other civil rights program compliance review or audit to be performed on the airport sponsor or any of its sub-recipients by any State, local or Federal agency.
[14] Includes allegations of discrimination based on race, color, national origin (including LEP), sex (including sexual orientation and gender identity), creed, or age, whether because of actions of the airport sponsor itself, or its employees, contractors, or tenants. Includes noncompliance with related administrative requirements under civil rights laws.
[15] Complaints of employment discrimination must be addressed as required by EEOC and other applicable authorities with jurisdiction over employment matters. If an Airport sponsor employment activity is supported by FAA-provided financial assistance or it is alleged that the employment discrimination affects the broader airport program, complaints about that activity must also be reported to FAA.